
Charts
Turn numbers into bar, line, area, pie and donut charts that live inside your notes.
A chart in inkwell is a small block of JSON in your note. inkwell draws it for you as soon as the block is valid, in both Normal mode and the preview.
Insert a chart
- On an empty line, type
/chartand press EnterEnter. - The Insert Chart window opens. Pick a Chart type: Bar, Line, Area, Pie or Donut.
- Optionally add a Title.
- Fill in the Data grid. Each row is one label with its value. Click + Row to add more.
- For bar, line and area charts, click + Series to compare several sets of numbers. Name each series in its column header.
- Click Insert Chart.
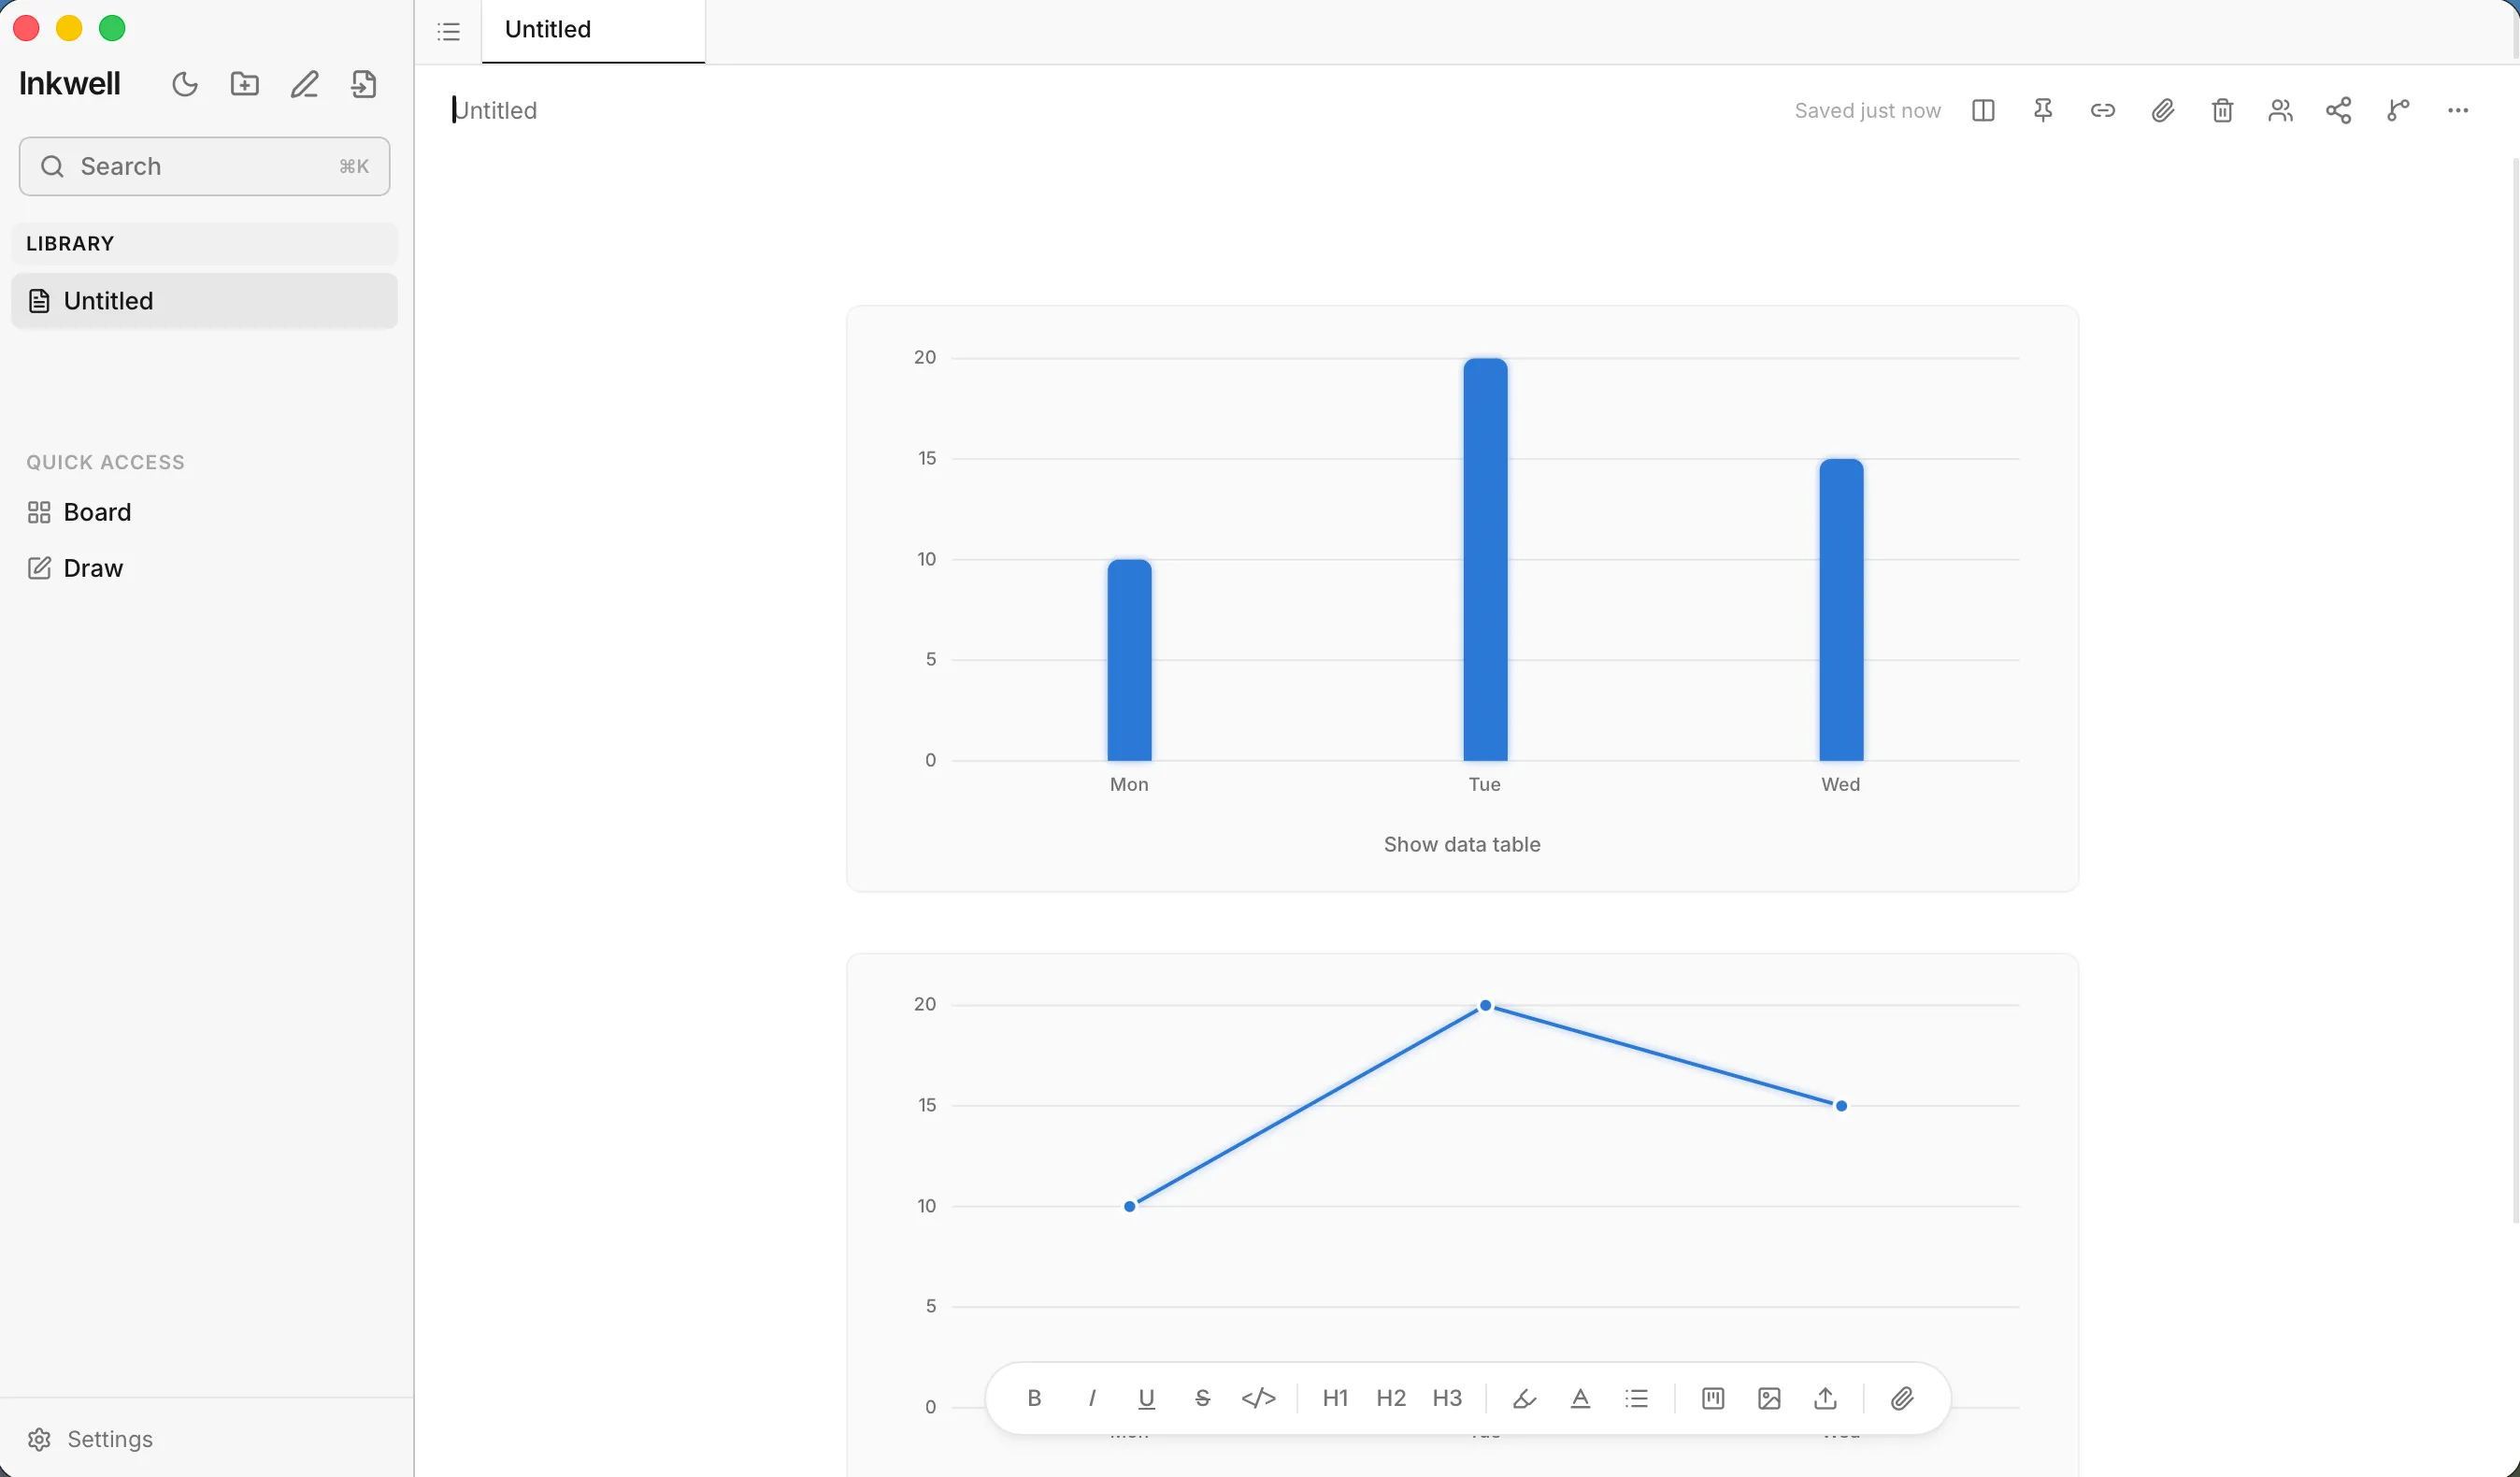
Edit a chart later
Hover a chart and click the code icon (Edit chart source). You get two choices:
- Edit with chart builder reopens the same window with your current data, ready to change. Save with Save Changes.
- Edit as Markdown shows the raw block so you can edit the JSON directly.
Click Show data table under a chart to see its numbers as a table, and Hide data table to tuck it away again.
The chart block
Every chart is a fenced code block with the language chart. You can write or paste one yourself:
```chart
{
  "type": "bar",
  "title": "Weekly sales",
  "labels": ["Mon", "Tue", "Wed"],
  "datasets": [
    { "label": "Sales", "data": [10, 20, 15] },
    { "label": "Costs", "data": [5, 8, 6] }
  ]
}
```| Field | Required | What it does |
|---|---|---|
type |
Yes | One of bar, line, area, pie or donut (not case-sensitive). |
title |
No | A heading for the chart. |
labels |
Yes | A list with at least one label: the categories along the bottom, or the names of the slices. |
datasets |
Yes | A list with at least one dataset. |
datasets[].data |
Yes | The numbers, in the same order as labels. Values are converted to numbers. |
datasets[].label |
No | The series name shown in the legend. Defaults to “Series 1”, “Series 2” and so on. |
Examples to copy
A pie chart (it uses only the first dataset):
```chart
{
  "type": "pie",
  "title": "Where my time goes",
  "labels": ["Writing", "Meetings", "Email"],
  "datasets": [{ "data": [12, 6, 4] }]
}
```
A line chart with two series:
```chart
{
  "type": "line",
  "title": "Signups",
  "labels": ["Jan", "Feb", "Mar", "Apr"],
  "datasets": [
    { "label": "Free", "data": [120, 150, 180, 240] },
    { "label": "Paid", "data": [20, 28, 35, 60] }
  ]
}
```
How charts look
- Each series gets its own colour from your current theme, so charts stay readable in light and dark themes. Colours are assigned in a fixed order and repeat after eight.
- A legend appears when there’s more than one series (or more than one slice).
- Pointing at a bar, point or slice shows its value.
If a chart doesn’t draw
inkwell shows Chart error: followed by the problem. The most common ones:
| Message | Fix |
|---|---|
Invalid JSON |
A comma, quote or bracket is missing. Open Edit as Markdown and check the block. |
Unknown chart type "…" — use bar, line, area, pie, or donut |
Fix the type value. |
"labels" must be a non-empty array |
Add at least one label. |
"datasets" must be a non-empty array |
Add at least one dataset. |
datasets[0] must have a "data" array |
Every dataset needs a data list. |